It’s very easy to debug Node.js in Visual Studio Code.
Open Visual Studio Code, go to “Settings”, search “node debug”. The first result item is “Auto Attach”, set it as “on”;
Open your “Node.js” project in Visual Studio Code. Make sure you run “npm install” to download all the dependencies;
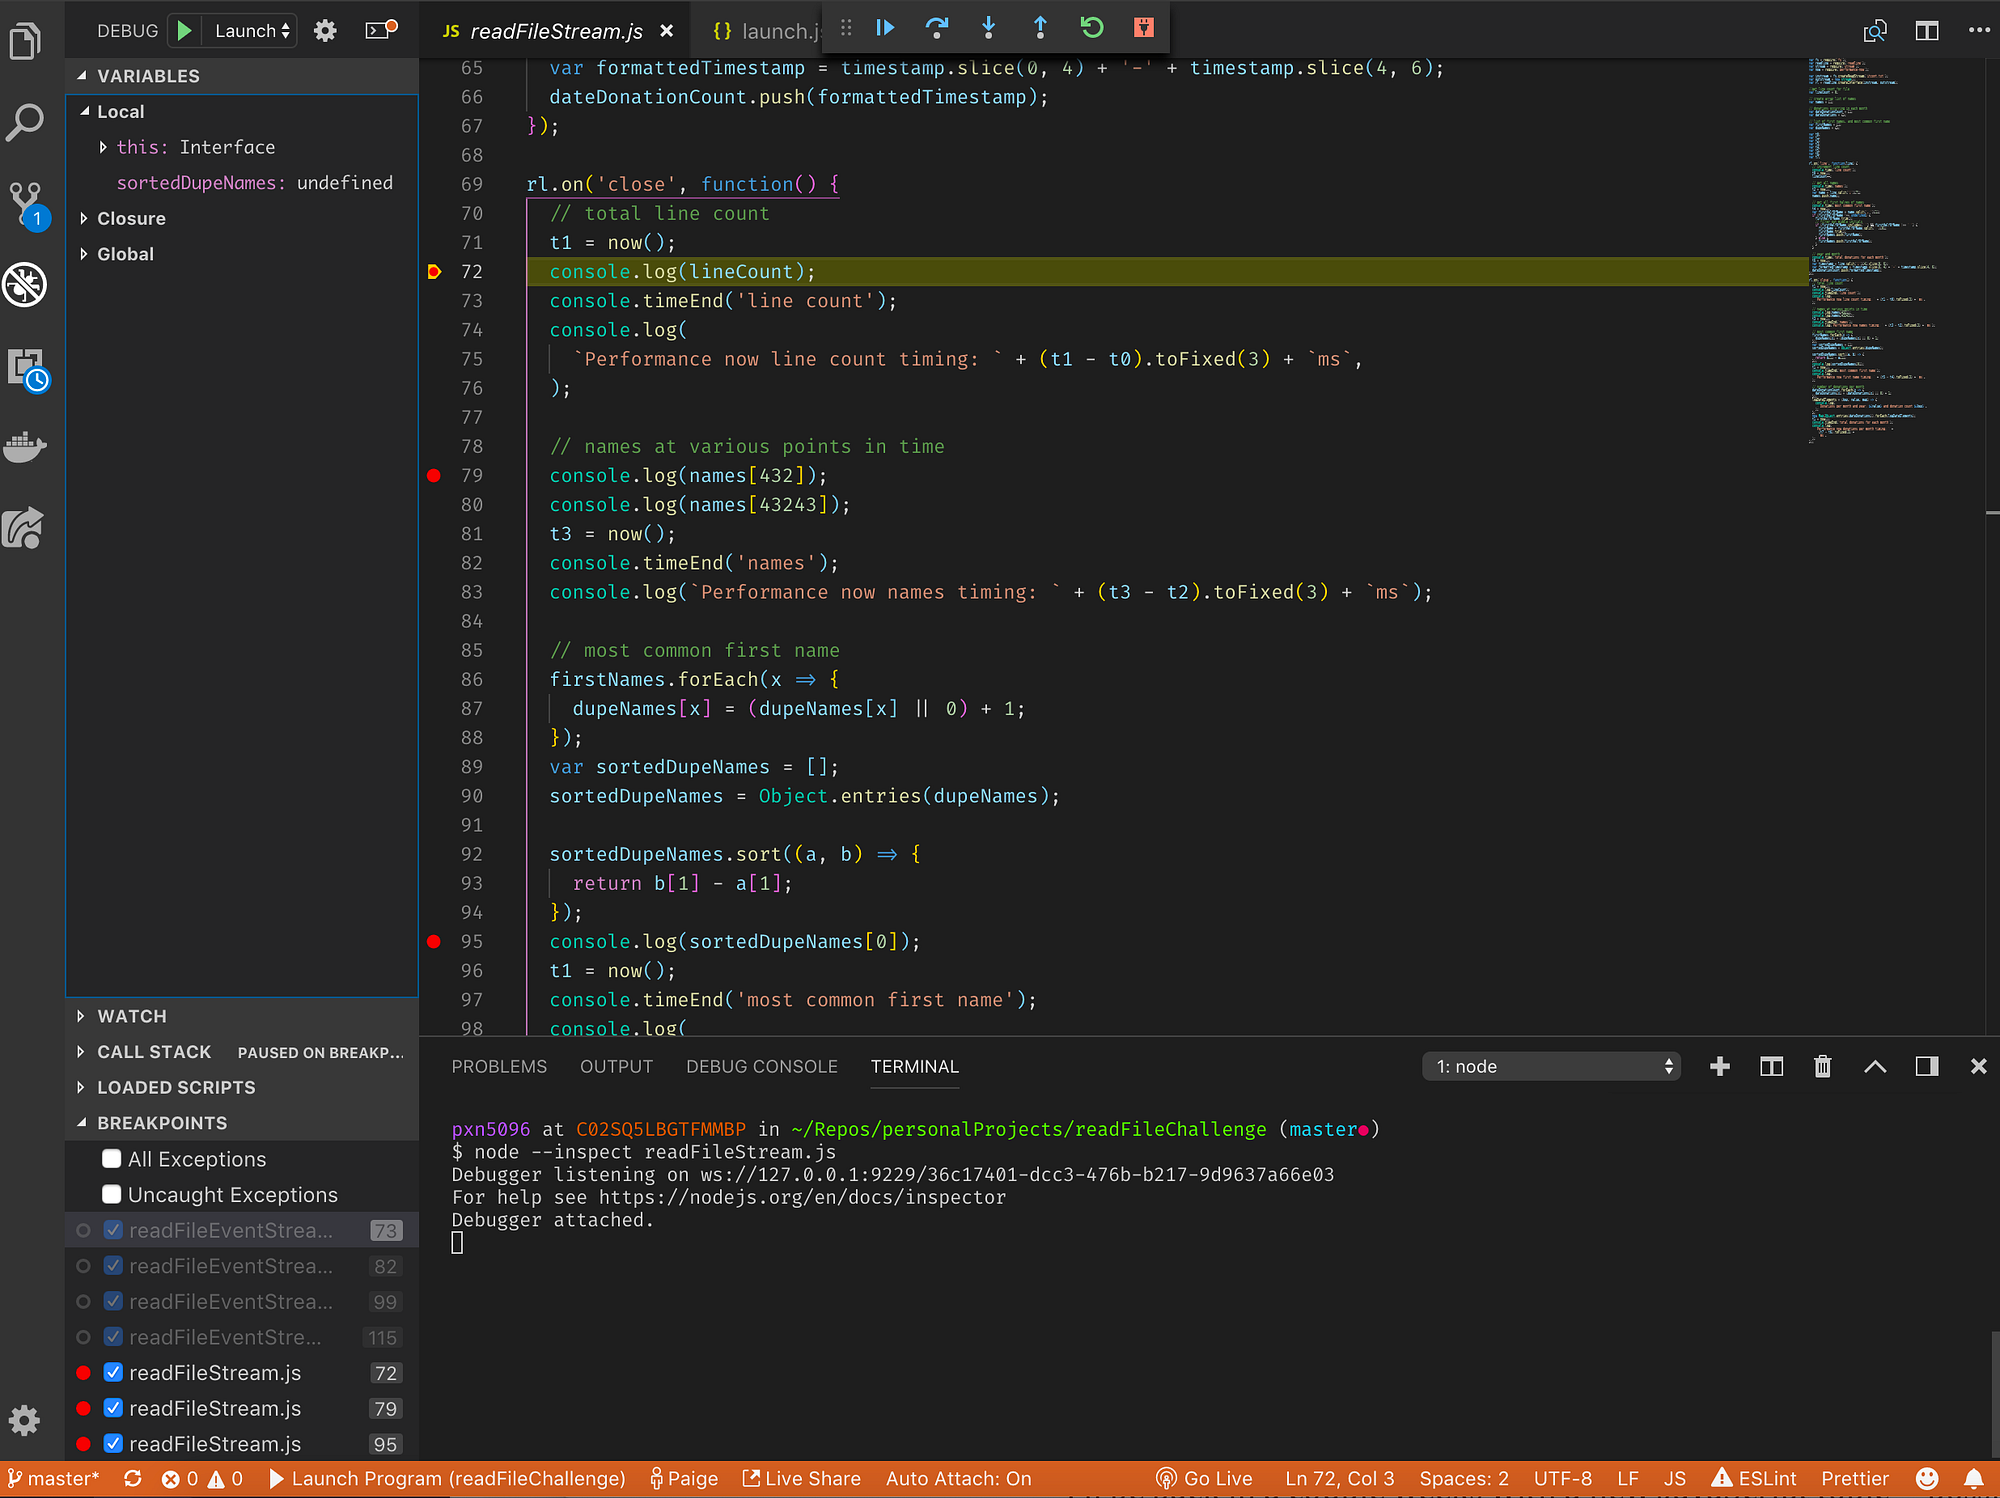
Open a “js” file, click the right side of the line number where you want to add a breakpoint, a red dot will be shown which means the breakpoint is added;
Show the panel(on Mac click “CMD + J”), open the “TERMINAL” tab, start the “Node.js” application such as “node inspect ./readFileStream.js”. Note the “inspect” option is required. Now you should see the execution stops at the breakpoint you set in step 3.
You can check the “DEBUG CONSOLE” tab to get the console output. You can also point mouse to a variable in the editor to view the variable content.